With over 600,000 funds and an average balance of around $1.2 Million, Self-Managed Superannuation Funds (SMSFs) make up for a significant portion of total superannuation assets in Australia.
One of the main reasons that SMSFs are a popular choice for Australians in their retirement planning, is that individuals feel they have control over their retirement savings. However, with this decision making power comes responsibility. Some SMSF trustees manage all of the fund investments while others use an investment adviser to provide this service. Many also use a combination of both approaches – for example, they may attend to direct property themselves and use an investment adviser to look after the equities portion of the portfolio.
While some Trustees would have a very good knowledge of the investment returns and costs of their fund, many are left to interpret their statutory annual reports for this. These reports are often directed at compliance experts and it can be difficult for Trustees to fully understand how their investments are tracking relative to other indicators such as industry funds or investment benchmarks.
Calculating your SMSF performance
The idea of analysing the statutory report and extracting the performance information may seem daunting but can be quite simple. It’s just a matter of applying a formula to the relevant set of numbers.
Here’s how a Trustee could calculate the investment performance by using the Fund’s annual Operating Statement and Balance Sheet reports.
From the Operating Statement:
A. Calculate Gross investment income – be sure to leave out member contributions and any amounts rolled into the fund
B. Calculate investment related expenses – leave out member withdrawals, life insurance premiums and general administration expenses such as audit & accountancy fees
C. Net investment return (before tax) = A – B
D. Calculate the income tax expense (or refund) that relates to the net investment income – exclude the tax (15%) applicable to any concessional contributions
E. Investment return after tax = C – D
From the Balance Sheet:
F. Calculate average assets for the year – this will usually be the opening and closing net assets divided by 2 but a more sophisticated approach would be to use say a monthly weighted average of net assets to recognize significantly contributions/withdrawals during the year
The after-tax return % = E divided by F x 100
The practical application of this relatively simple process can be illustrated in the following example
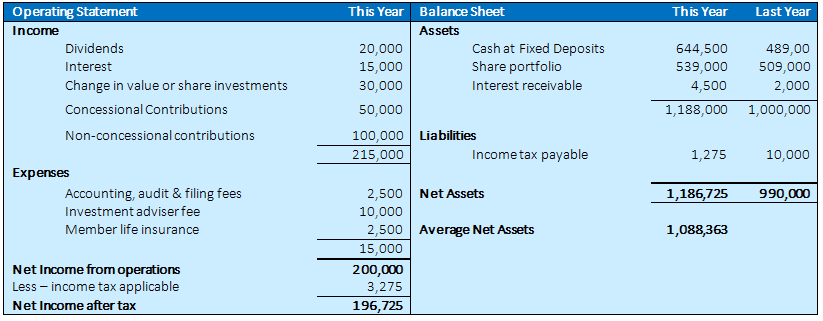
Applying the formula to the above example, the components are:
A (investment income) = $20,000 + $15,000 +$30,000 = $65,000
B (investment expenses) = $10,000
C (net investment return) = $65,000 – $10,000 = $55,000
D (tax related to investment return) = $4,225 credit ($7,500 relates to concessional contributions less $4,225 = $3,275)
E (investment return after tax) = $55,000 + $4,225 (tax credit) = $59,225
F (average assets) = ($1,186,725 + $990,000) / 2 = $1,088,363
E (investment return after tax) = ($59,225 / $1,088,363) x 100 = 5.44%
Another important ratio that trustees may be interested in, is administration expenses as a percentage of average assets. Using the above sample data this would be calculated as:
- Administration expenses = $2,500 divided by average assets $1,088,363 x 100 = 23 %
Having calculated these ratios, the obvious question is; “how do these compare to other superannuation funds or alternatives?”. There are several “benchmarks” that a fund could choose to look at for comparison purposes. The Australian Taxation Office does provide some data, but this is limited and tends to be quite dated by the time it is released.
Some other possible benchmarks might include:
- All Ordinaries Accumulation Index: this provides the return from a theoretical basket of investments representing the All Ordinaries Index on the Australian Share Market including growth in value and dividends (grossed up by franking credits). It is, therefore, a useful benchmark for portfolios of listed Australian Shares. As an example, this index rose by 11.03% for the year ended 30th June 2019.
- Indices relating to specific investment sectors such as property, fixed interest, etc.
- Returns from the large Industry Funds: these are published and available for various member-selected investment mix options. As an example, the return for the “balanced fund” option of Australian Super for the year ended 30th June 2019 was 8.67%
- Returns compiled by investment research firms such as Chant West or MSCI
- Returns achieved by various index funds and Exchange Traded Funds
When comparing SMSF returns and costs to benchmarks and other alternatives it is important to take account of unique and particular issues that may affect the data in the different sectors. Some examples of these issues include:
- SMSFs would rarely revalue direct property investments every year
- An SMSF fully in pension mode with a significant share portfolio paying franked dividends would be expected to have a higher after-tax return than if the same fund was in accumulated phase.
- Some administration cost of industry or retail funds may be “hidden” in net investment returns.
To get a quick comparison of the administration cost structure for your SMSF, complete the form below and a Practical Systems Super representative will be in touch.
The information provided in this article is general in nature and does not take into account your personal circumstances, needs, objectives or financial situation. This information does not constitute financial or taxation advice. Before acting on any information in this article, you should consider its appropriateness in relation to your personal situation and seek advice from an appropriately qualified and licensed professional.
BOB LOCKE – CHARTERED ACCOUNTANT & SMSF SPECIALIST
Mr Locke has been an accountant and taxation expert for 35 years. His company, Practical Systems Super, provides an all-in-one SMSF solution with a full administrative service, SMSF management software, and independent, licensed advice, tailoring their package to meet the individual needs of trustees and SMSF professionals.
To find out more about Practical Systems Super, visit www.pssuper.com.au, or call 1800 951 855.